Welcome R - Starter Analysis of Pima Indians Diabetes Dataset
This post walks through a starter analysis of the Pima Indians Diabetes dataset using R. The dataset has been sourced from Kaggle - one of the data sources mentioned in the previous post.
The dataset is in tabular format. Each row represents a patient of Pima Indian heritage. The columns contain various health measurements, plus a target boolean column indicating whether a patient has diabetes. The objective is to use the health measurements to predict diabetes status.
Exploratory Analysis
The first commit includes an exploratory analysis of the Pima Indians dataset.
Here are the results:
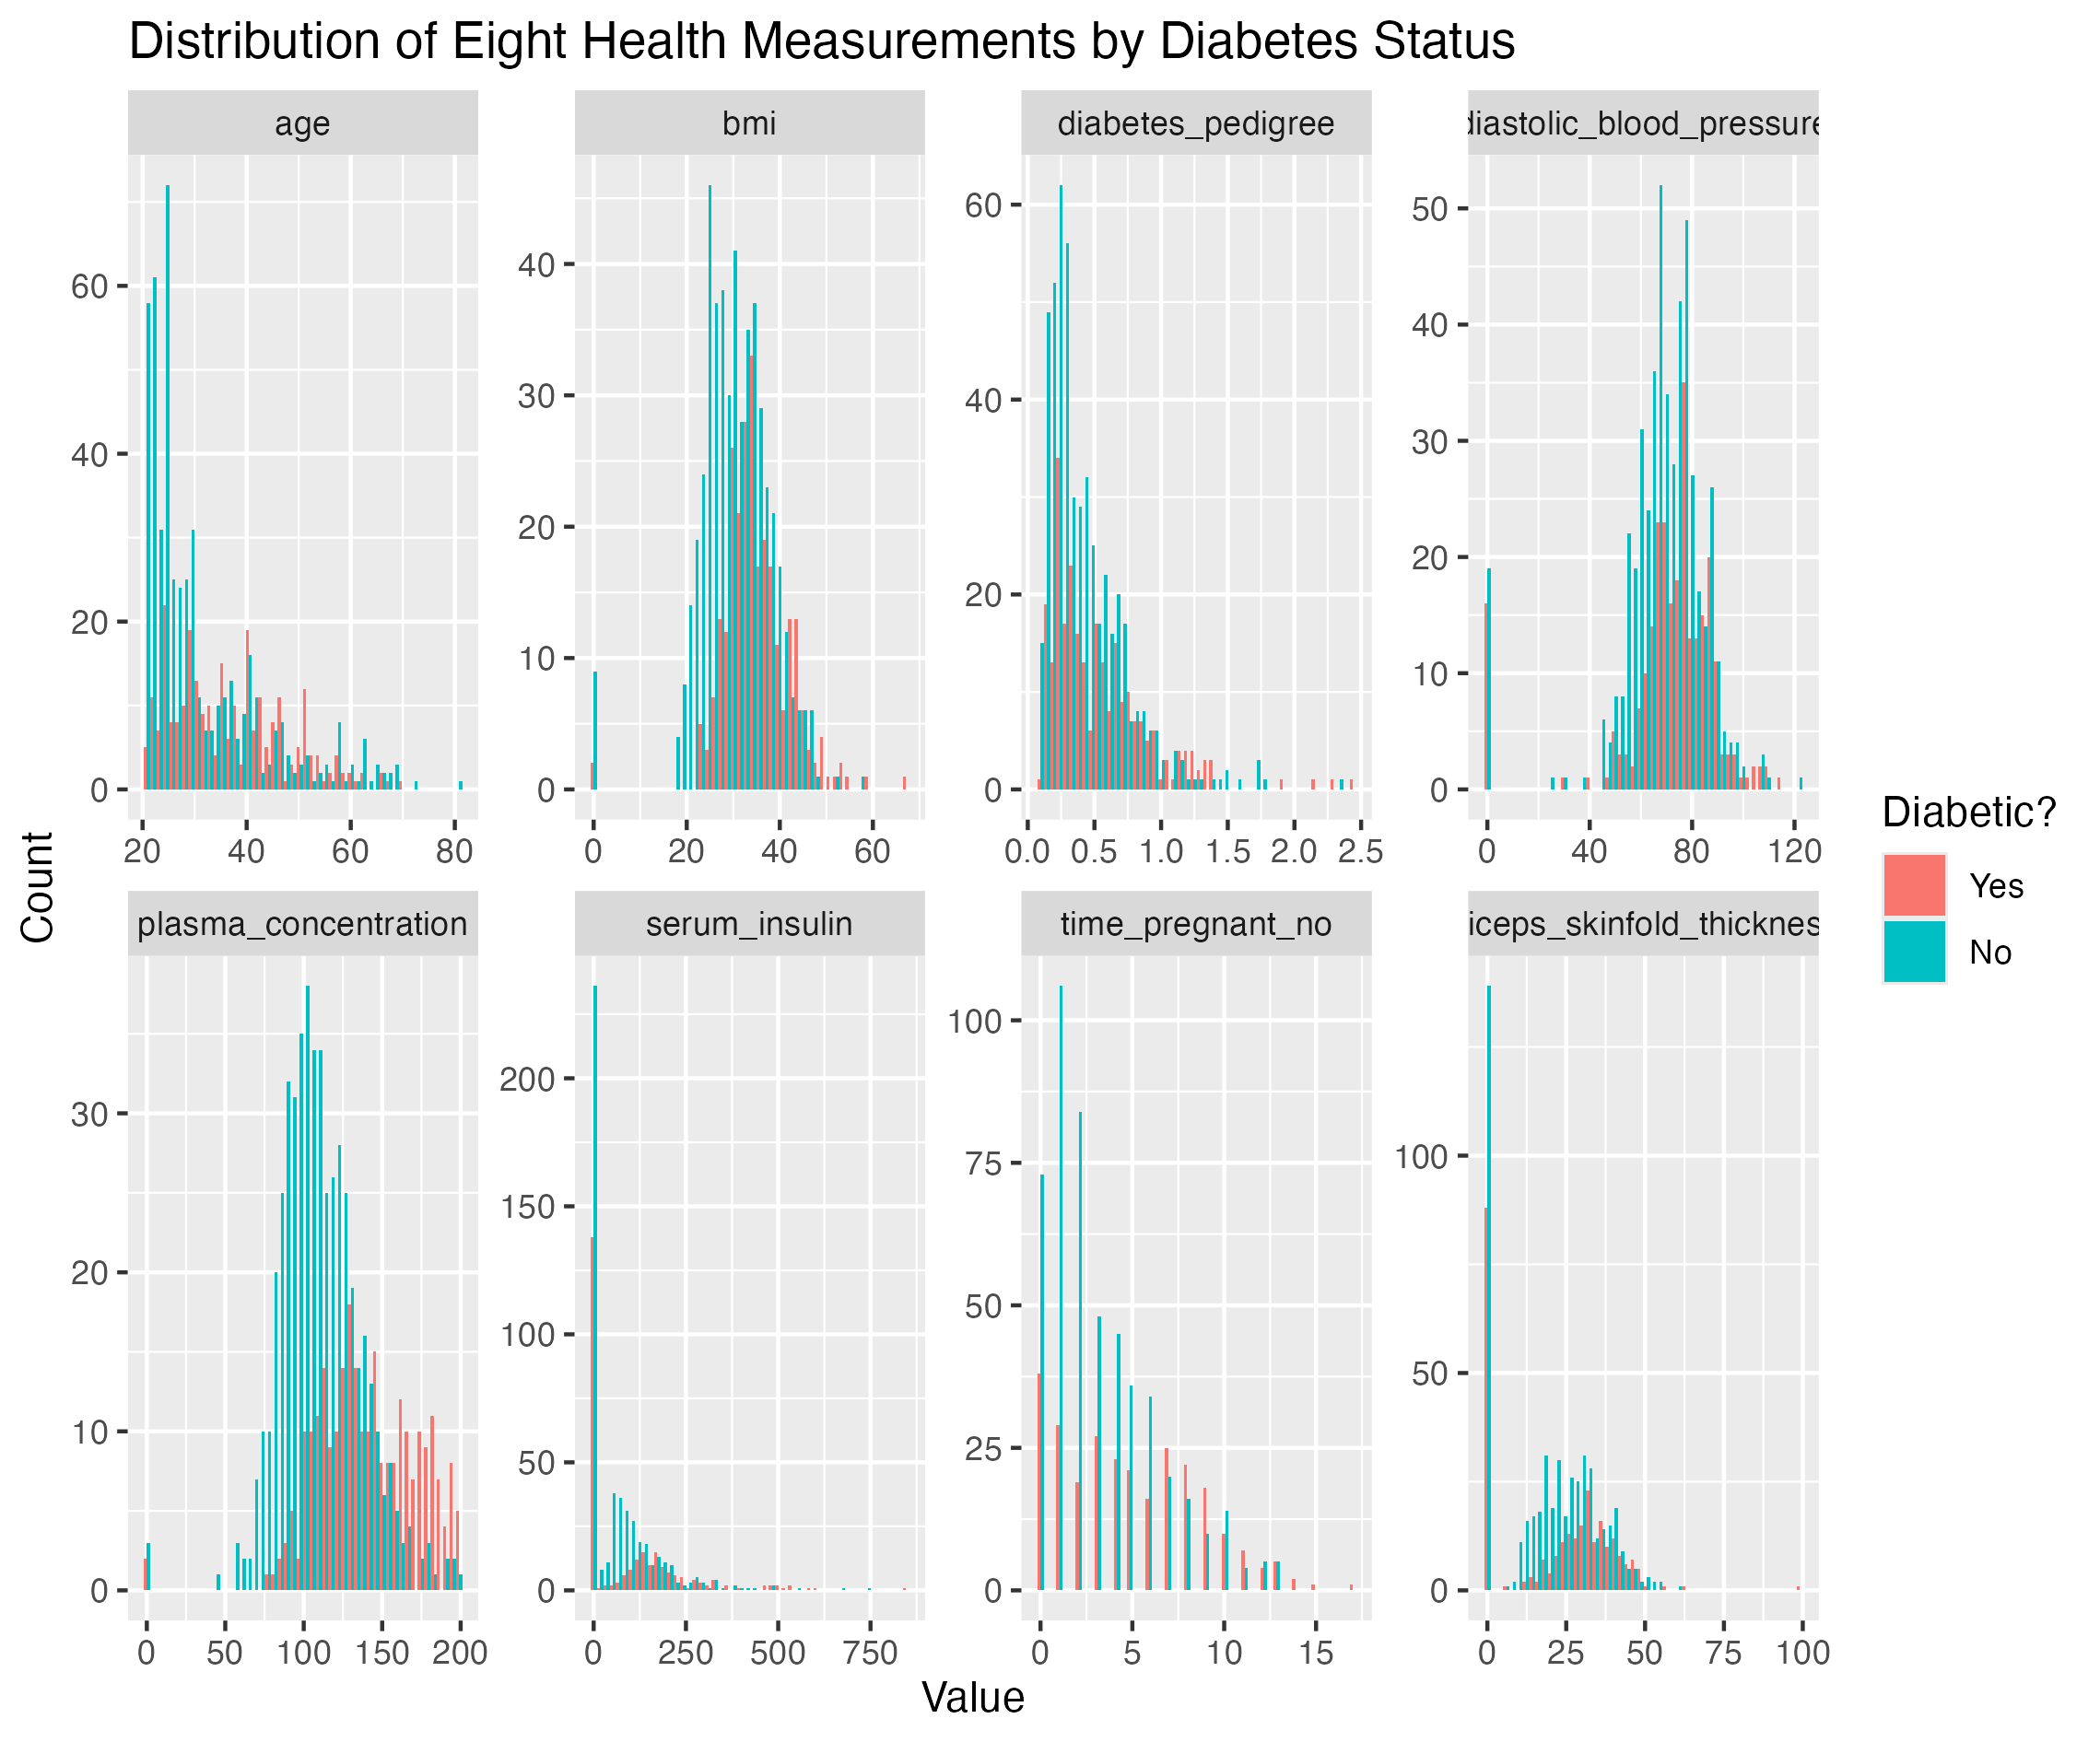
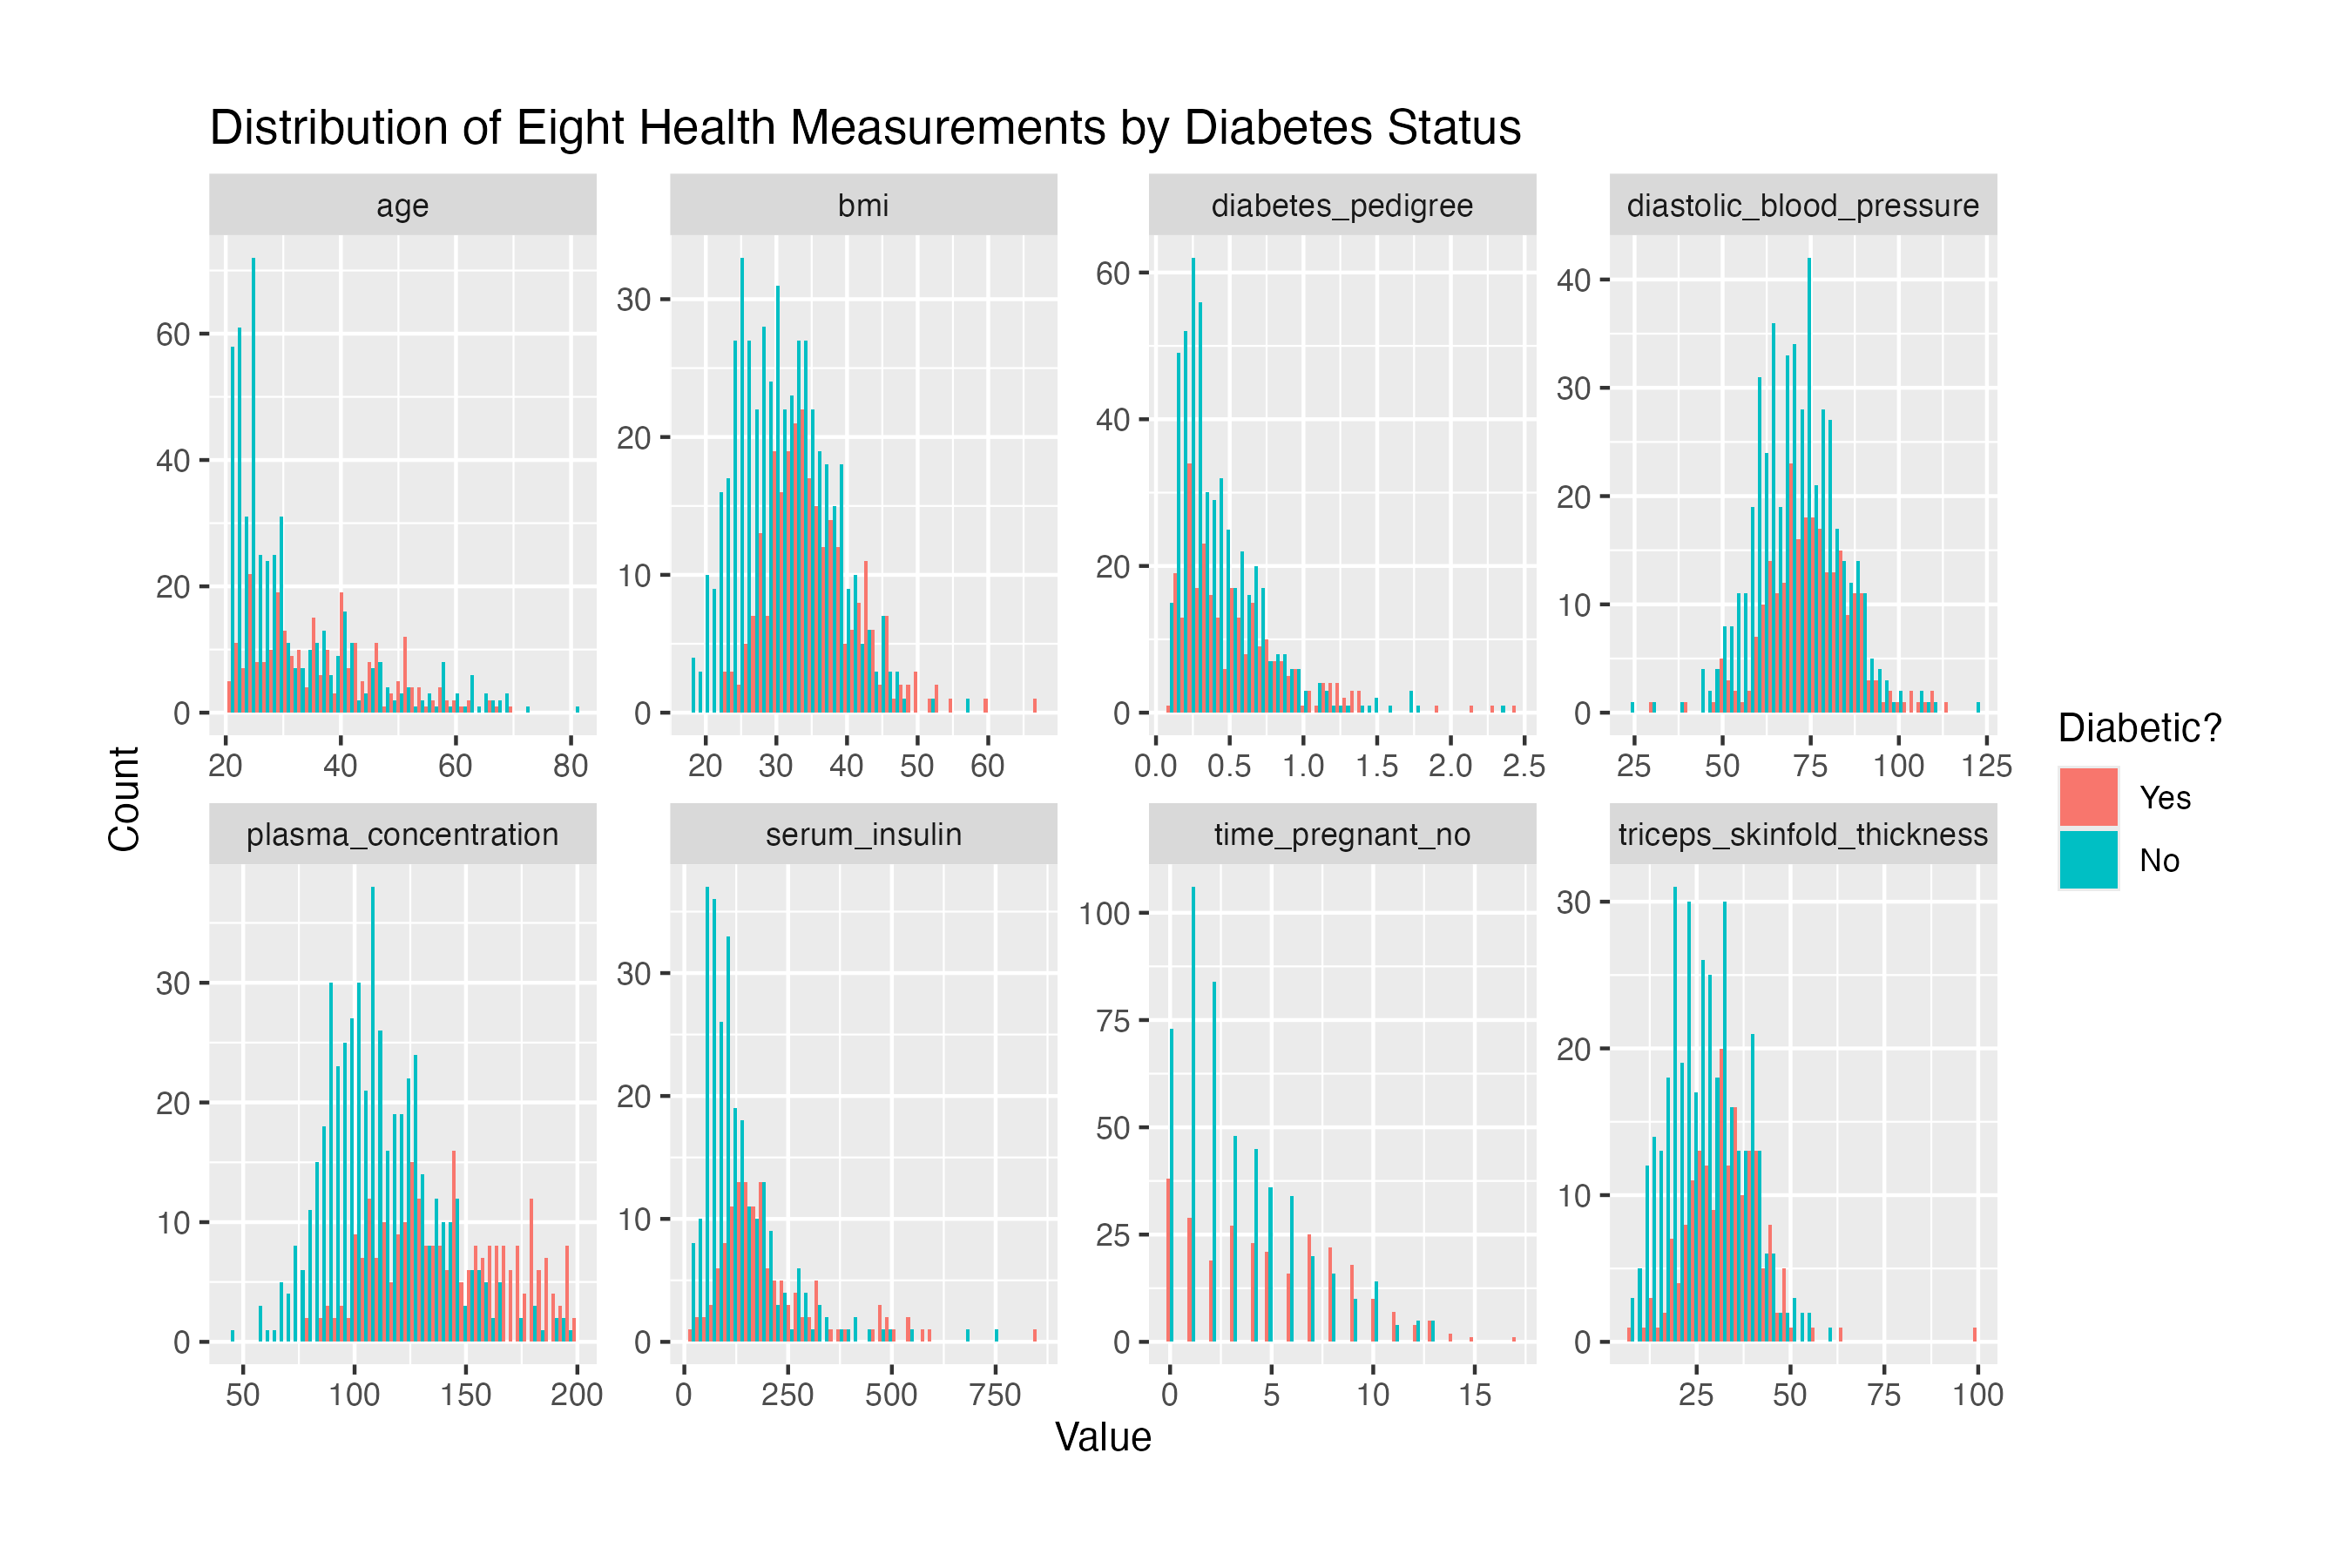
The plot summarises the distributions of the eight health measurements, grouped by diabetic and non-diabetic observations. One peculiarity that stands out is the disproportionate number of zeroes, which - upon closer inspection - represent missing values.
Once the zeroes are replaced with NA (and thus excluded from the plot), no other obvious outliers remain:
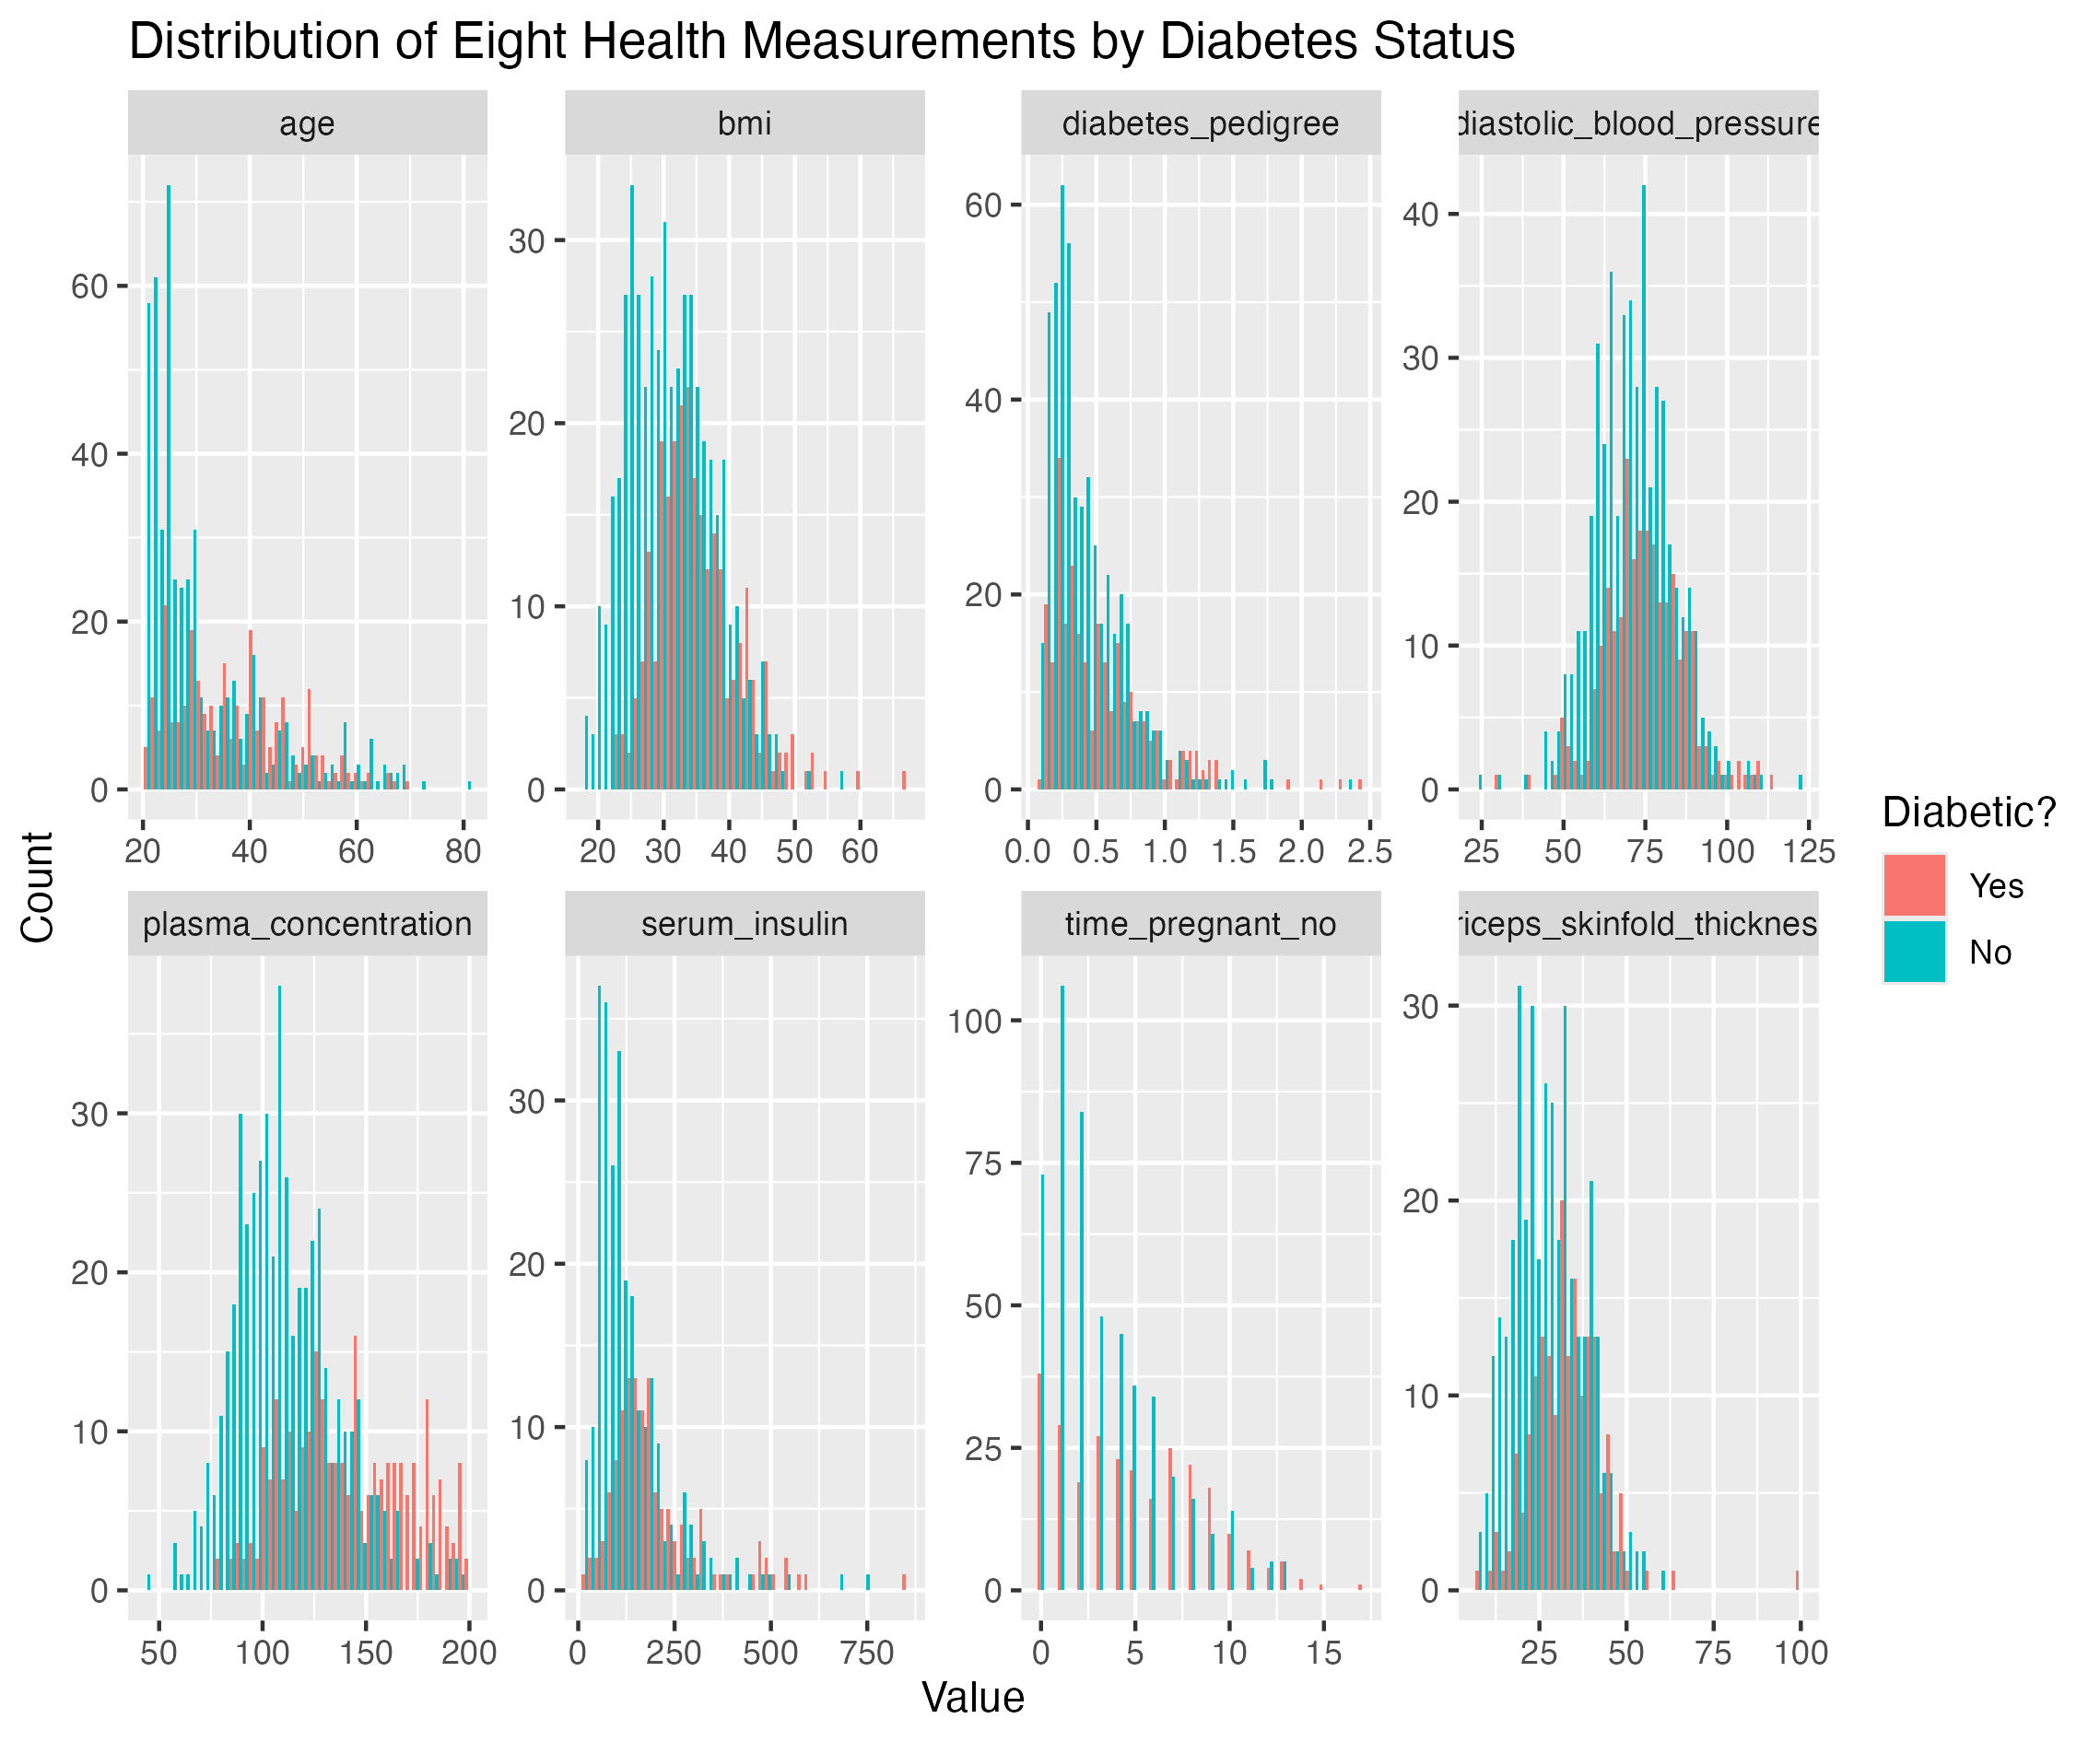
What else can be observed in the plot? The diabetic and non-diabetic distributions are similar, with non-diabetic (green) observations typically having smaller values. The hope is that, when the values are combined in the eight-dimensional space, the differences become more apparent, allowing a predictive model to distinguish between the two classes.
Predictive Modelling
The second commit introduces predictive modelling, carried out in three steps:
- Splitting the dataset into 75% training and 25% testing partitions.
- Fitting a decision tree model with default parameters.
- Fitting a random forest model with default parameters.
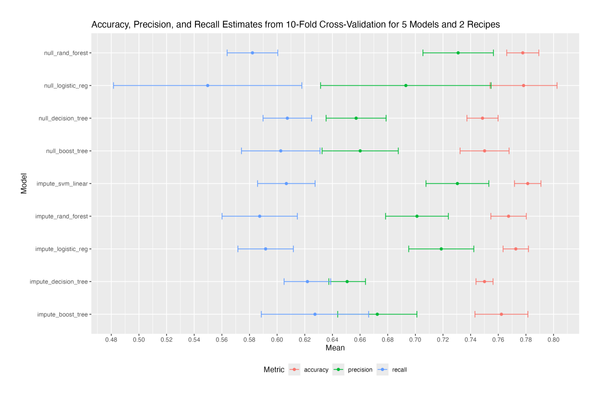
Here are the results: the decision tree achieved 72.9% accuracy, and the random forest 73.4% accuracy.
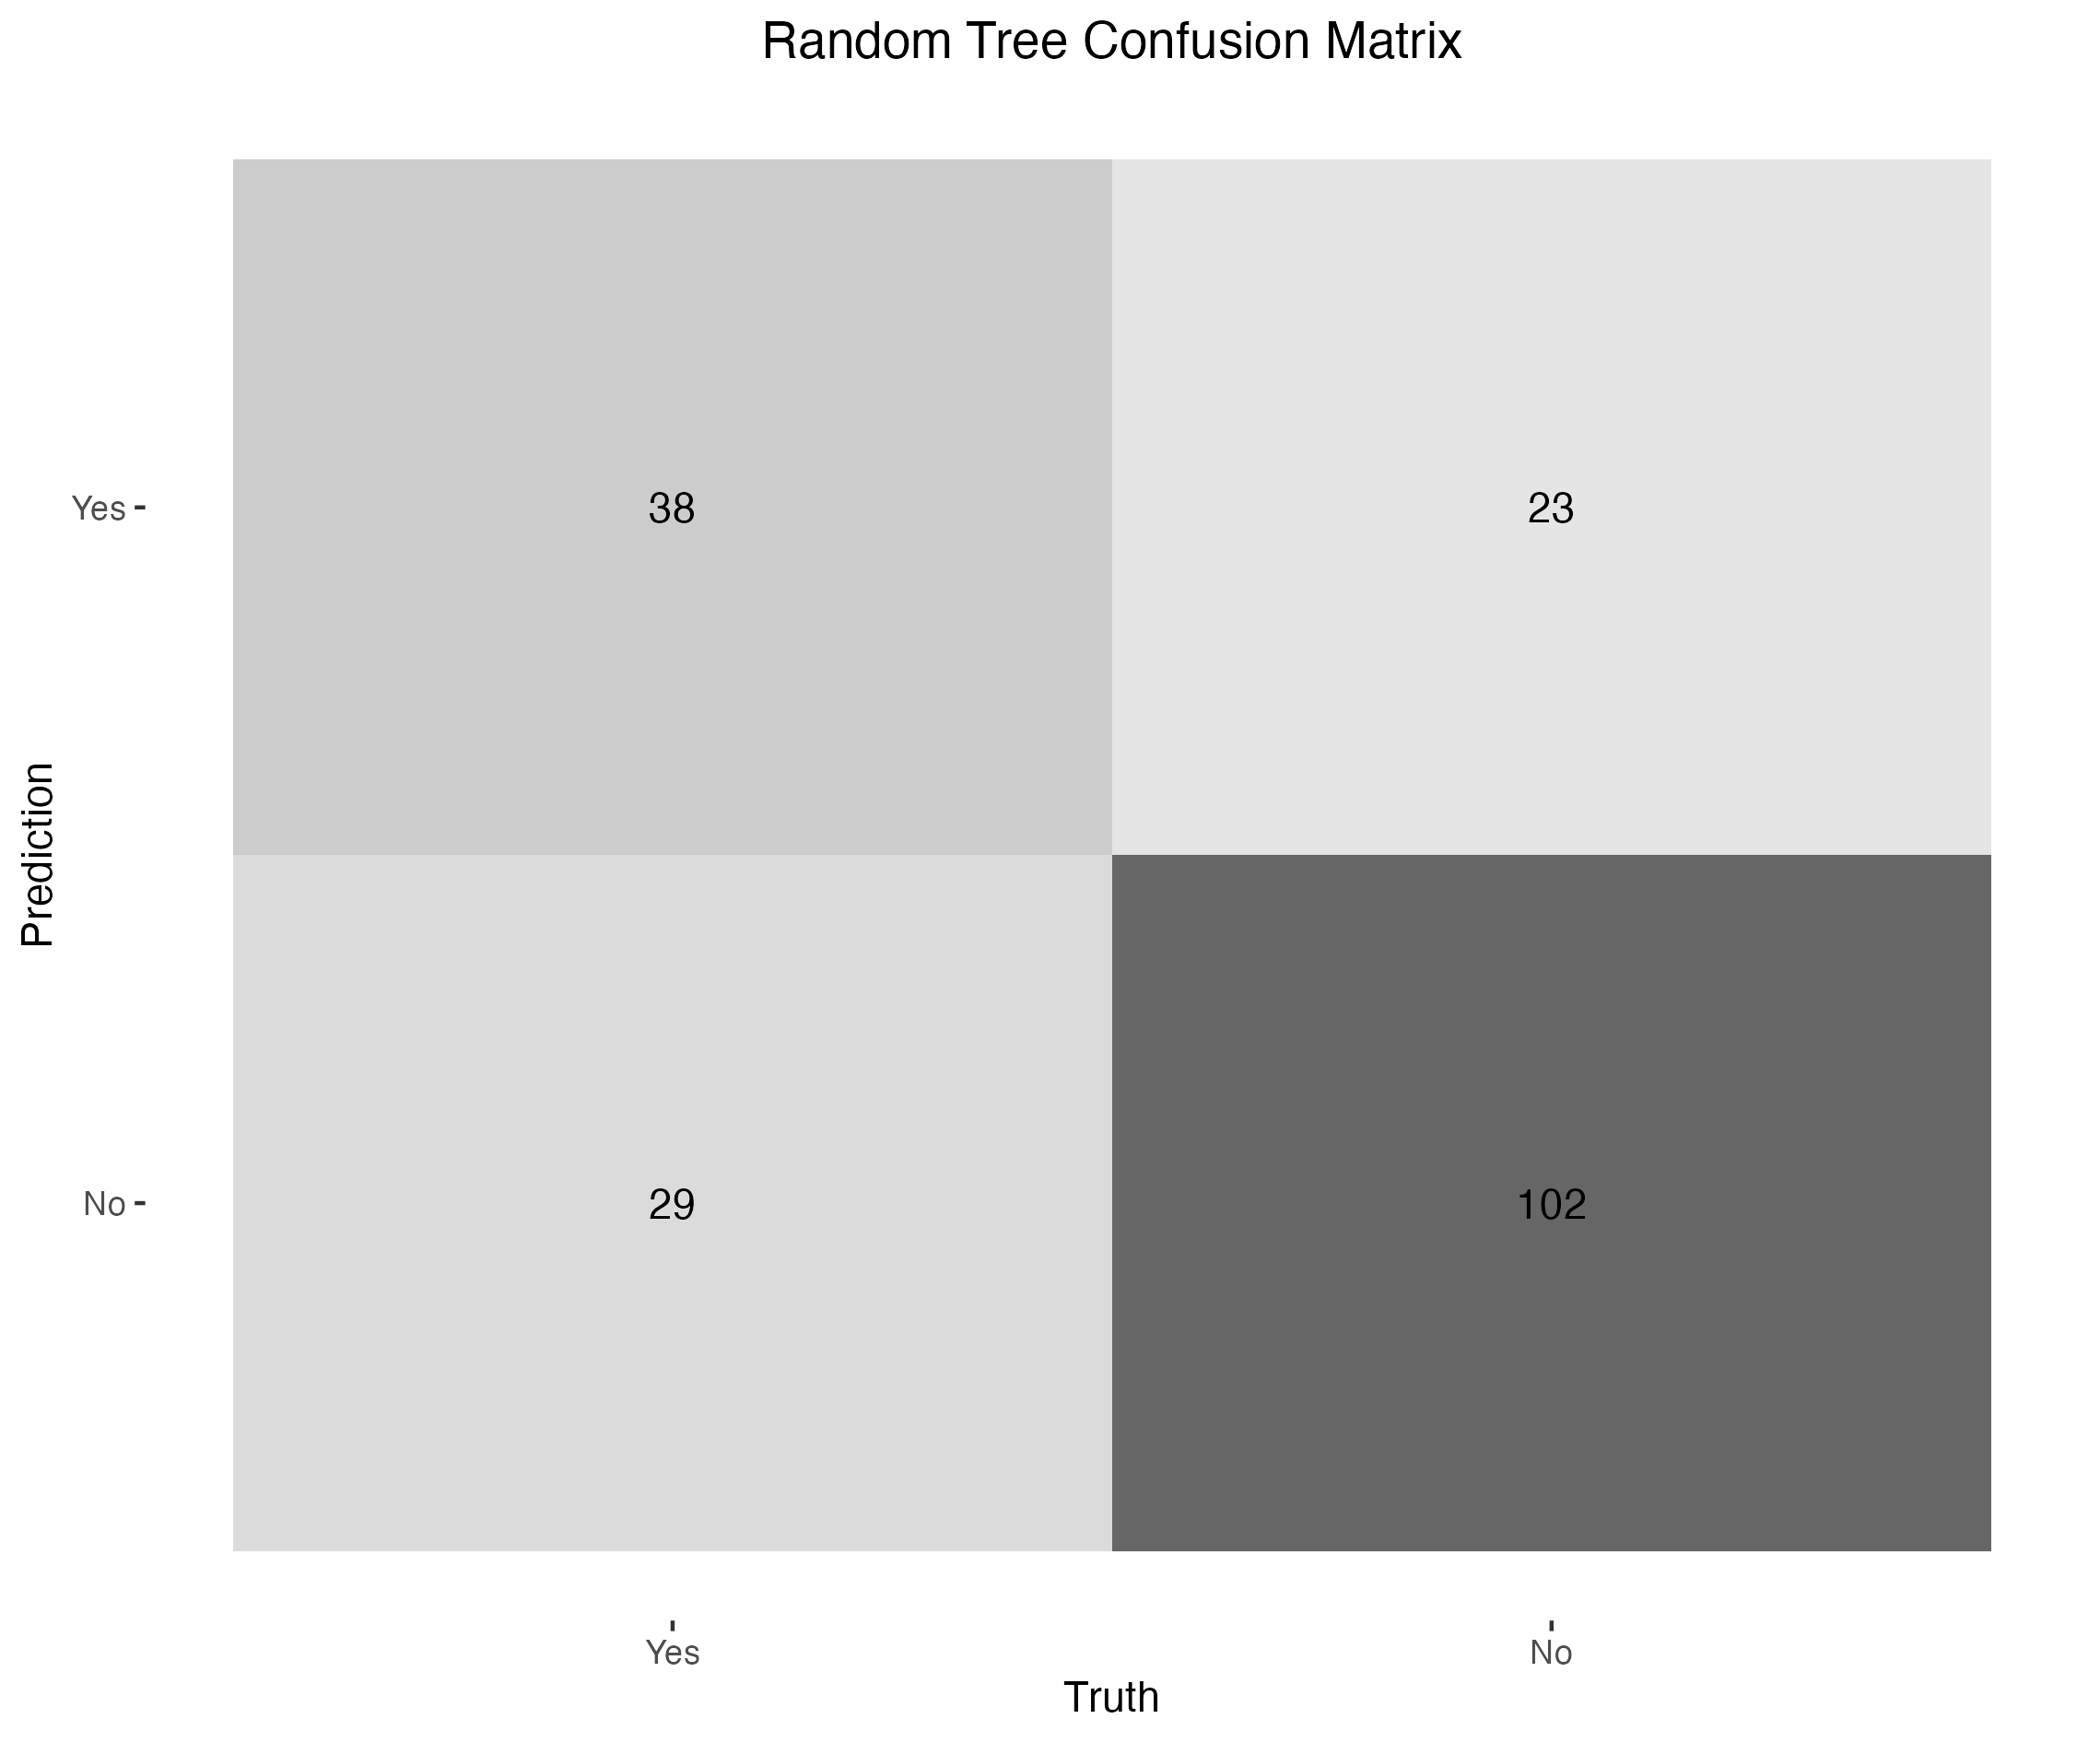

Rounding to the nearest percent, the resulting baseline accuracy is 73%. How good is this result?
One way to assess it is by comparison to a constant classifier. The dataset contains 500 non-diabetic and 268 diabetic observations, meaning a model that always predicts “No” would achieve 65% accuracy. So, 73% is indeed an improvement - but only marginally.
Another point of reference is other analyses. By browsing Kaggle notebooks, one can find claims of 80%+ and even 90%+ accuracy. Care needs to be taken here, as these analyses may not be directly comparable. They may use different train/test splits, or cross-validation, or even rely on overfitting. Nonetheless, such high accuracy results indicate that there is still room for improvement.
Conclusion
This post has presented a starter analysis of the Pima Indians Diabetes dataset and established a baseline prediction accuracy of 73% - a benchmark to be improved upon in subsequent posts.